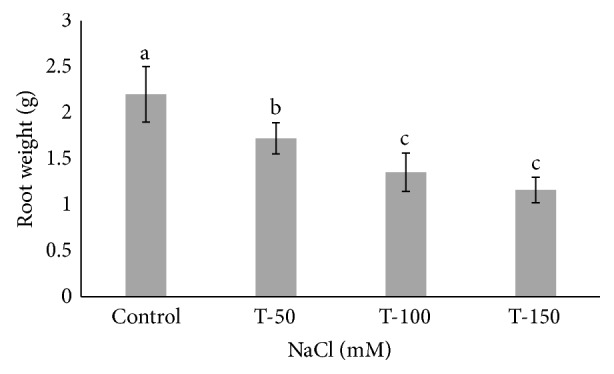
Figure 2.

Fresh root weight in Phoenix dactylifera grown at different concentrations of NaCl. Data represent means of four replicates ± standard deviation. Different letters on bars represent the significant values according to Duncan's test (p < 0.05).
