
Figure 3.
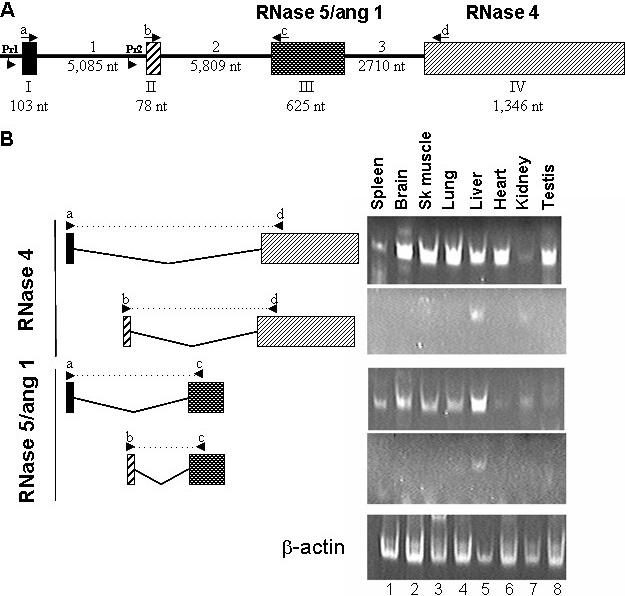
(A) Gene structure of the mouse RNase 4 and RNase 5/ang 1 locus. Exons are represented as boxes and introns are the intervening lines. The numbering denotes the size of each segment in the mouse genome. The RNase 5/ang 1 coding sequence is on exon III and the RNase 4 coding sequence is on exon IV. Lowercase letters and arrows indicate location and direction of RT–PCR primers used to generate data featured in (B). Pr1 and Pr2 refer to promoters examined in Figure 5. (B) Tissue-specific detection of exon I/exon II variants. RT–PCR was performed using primers complementary to sequences in either exon I (primer a, upper panel of each pair) or exon II (primer b, lower panel of each pair) in conjunction with primers complementary to the sequence of the coding region of RNase 5/ang 1 (primer c, exon III) or RNase 4 (primer d, exon IV) to identify tissue-specific expression of individual variants. Splicing pattern and relative position of primers are shown in the left hand side of Figure while RT–PCR data is shown in the right. Actin primers were used as a positive control.