
Fig. 1.
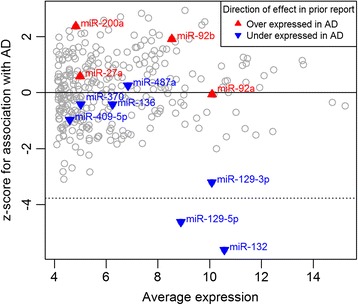
Validation of miRNAs associated with AD in other studies. The relationship between average miRNA expression (x-axis) and association with pathological AD in ROSMAP (y-axis) is plotted for each miRNA. The association between a miRNA and AD is calculated as a z-score after correcting for other factors; a negative z-score denotes decreased miRNA expression in the context of AD. Previously reported miRNAs [12] are highlighted by colored triangles, with red denoting higher expression in AD and blue reduced expression in AD in the original publication. The dotted horizontal line marks the z-score threshold of significance that is equivalent to a Bonferroni p-value cut-off of 0.05; none of the miRNAs with positively correlated expression are significantly associated with AD. The gray circles represent all other miRNAs tested in our study