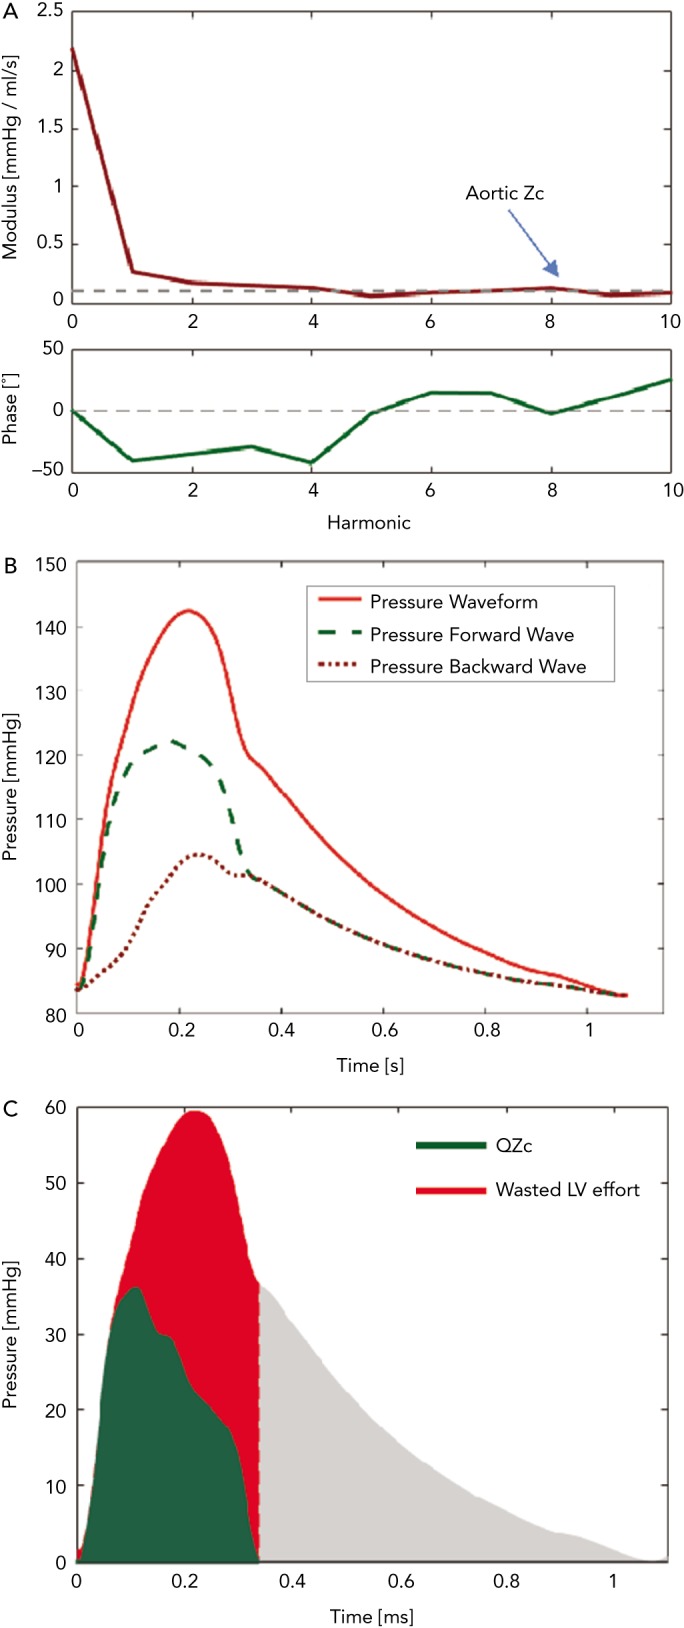
Figure 3: Assessment of Arterial Load and Ventricular– Arterial Interactions with Pressure–Flow Relations.

(A) Modulus (top) and phase (bottom) of aortic input impedance. The dashed line in the modulus plot represents aortic Zc. (B) Wave separation analysis showing forward (green dashed line) and backward (red dotted line) waves. (C) Time-domain analysis of the time-integral of the QZc product (green area, which represents the pressure generated as a result of the pulse flow interacting with the aortic root Zc) versus the additional systolic pressure related to wave reflections (represented by the red area). LV = left ventricular; QZc = product of flow and aortic characteristic impedance; Zc = aortic characteristic impedance.
