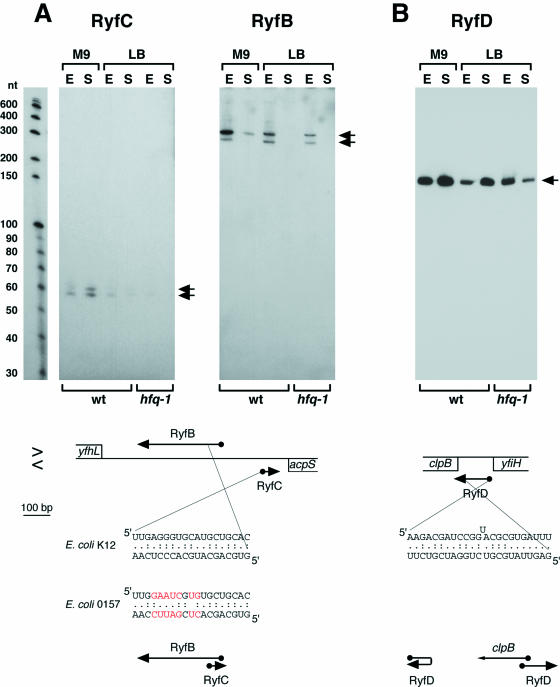
Figure 3.
Northern analysis of the (A) RyfB, RyfC and (B) RyfD RNAs derived from intergenic sequences. The samples were the same as in Figure 1, and the RNA marker lane similarly corresponds to one of the panels. Arrows indicate predominant bands. The arrangement of adjacent genes is shown below each panel as in Figure 2. Sequences capable of base pairing and diagrams of possible pairing arrangements are given below the gene arrangements. Bases that differ between E.coli 0157 and E.coli K12 are indicated in red. The 5′ ends of the RyfB, RyfC and RyfD RNAs (indicated by balls) all correspond to the actual transcription start.

