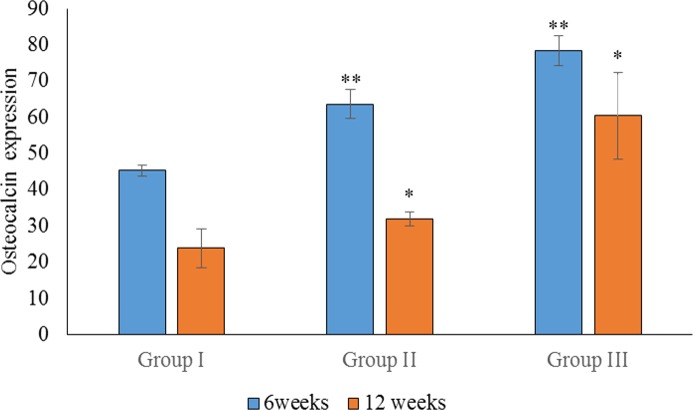
Figure 6. Statistical analysis of the percentage expression of osteocalcin as a bone-formation marker between groups I, II and III at 6 and 12 weeks.
Data are presented as the average of three independent experiments (n = 3). ∗∗Significant differences (p < 0.05) between control (group I) and experimental groups (groups II and III).

