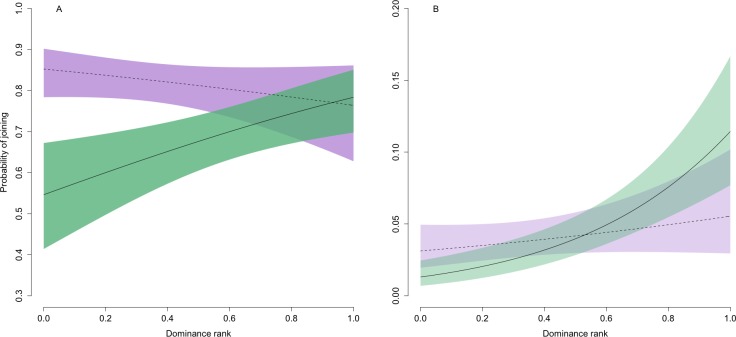
Figure 1. Predicted relationship between the probability of joining behaviour and dominance rank at the (A) patch and (B) sub-patch level.
For both panels, solid and dashed lines represent the predicted values for adults and juveniles, respectively. Shaded green (adults) and purple (juveniles) regions are bounded by upper and lower 95% confidence intervals. Note the difference in scale of the two y-axes, reflecting the much lower levels of joining across all individuals at the sub-patch compared with patch scale.

