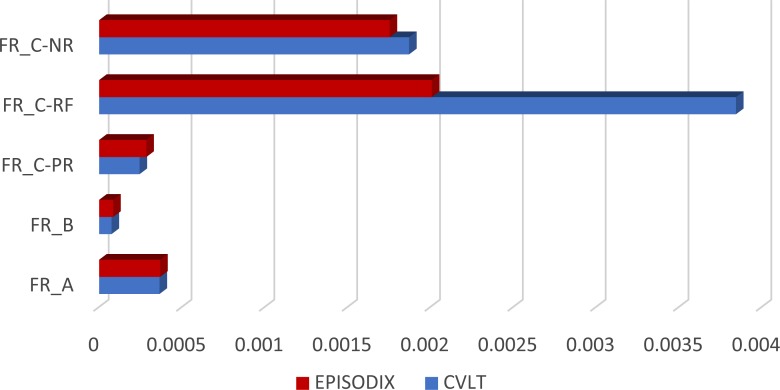
Figure 2. Frequency comparison of words/objects in CVLT and Episodix.
The vertical axis represents frequency values. vertical axis: FR_A: frequency of List A; FR_B: frequency of List B; FR_C-PR: frequency of prototype word in List C; FR_C-RF: frequency of related word in List C; and FR_C-NR: frequency of nonrelated word in list C.

