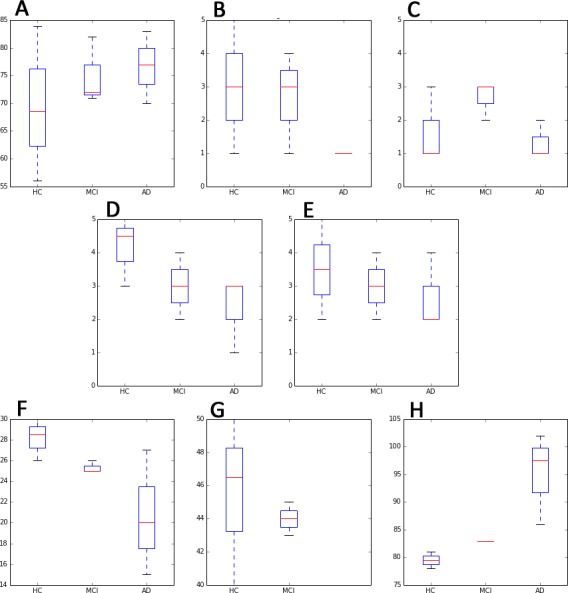
Figure 5. Main test subjects’ characteristics, distributed by cognitive groups (i.e., HC, MCI and AD).

In red is expressed the median value. (A) AGE; (B) Usage fz. ICTs; (C) Usage fz. Games; (D) Socialize Level; (E) Physical Exercise level; (F) MMSE [score]; (G) MAT [score] and (H) IQCODE [score]. Blue box plots are distributed by cognitive groups.
