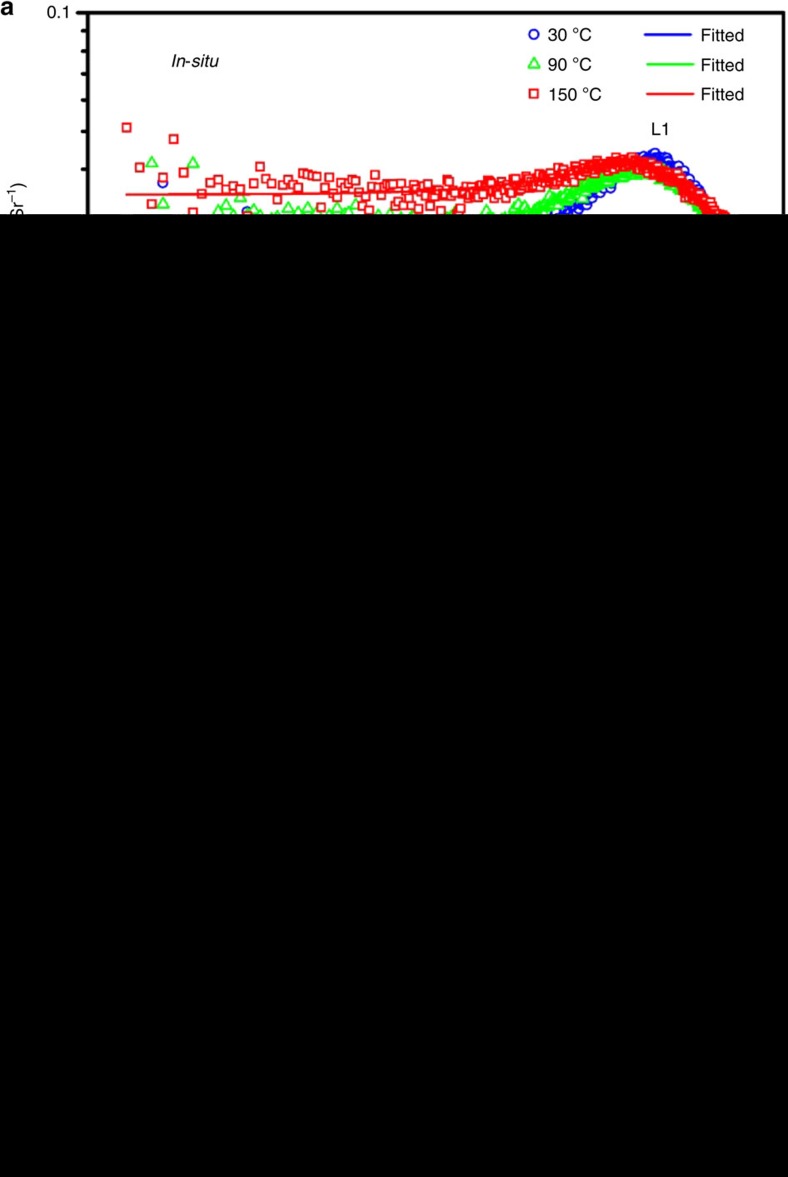
Figure 3. In-situ and ex-situ SAXS data of intermediates and MSCs.
(a) In-situ profiles showing the evolution of the intermediate in the induction period, with the overall diameter increasing from 1.05 nm at 30 °C (blue circular symbols) to 1.28 nm at 90 °C (green triangular symbols) and 1.54 nm at 150 °C (red squared symbols). Inset shows the model of monodisperse intermediates. (b) Ex-situ SAXS profiles for the 130 °C/30 min Intermediate 2 (dispersed in dry toluene with the 1–4 volume ratio of sample to toluene, grey star symbols), MSC-371 (in 0.5 ml OTA for 10 min, blue circular symbols), MSC-417 (in the mixture of 0.2 ml OTA, 0.2 ml ethanol and 0.1 ml toluene for 60 min, green triangular symbols) and MSC-448 (in the mixture of 0.1 ml ethanol and 0.4 ml toluene for 10 min, red square symbols). Each of the three MSC dispersions was prepared from the same 130 °C/30 min sample in toluene shown in Fig. 4b (grey) of 0.5 ml. The diameters of the three types of MSCs (D1, primary structure) are 0.97, 1.39 and 1.65 nm, respectively. The overall diameters of the MSC aggregation (D2, secondary structure) are 19.48, 21.77 and 24.24 nm, respectively. Inset shows the model of MSCs and their aggregation. The concentration of the in-situ sample is higher than those of the ex-situ samples. Details can be found in Methods.

