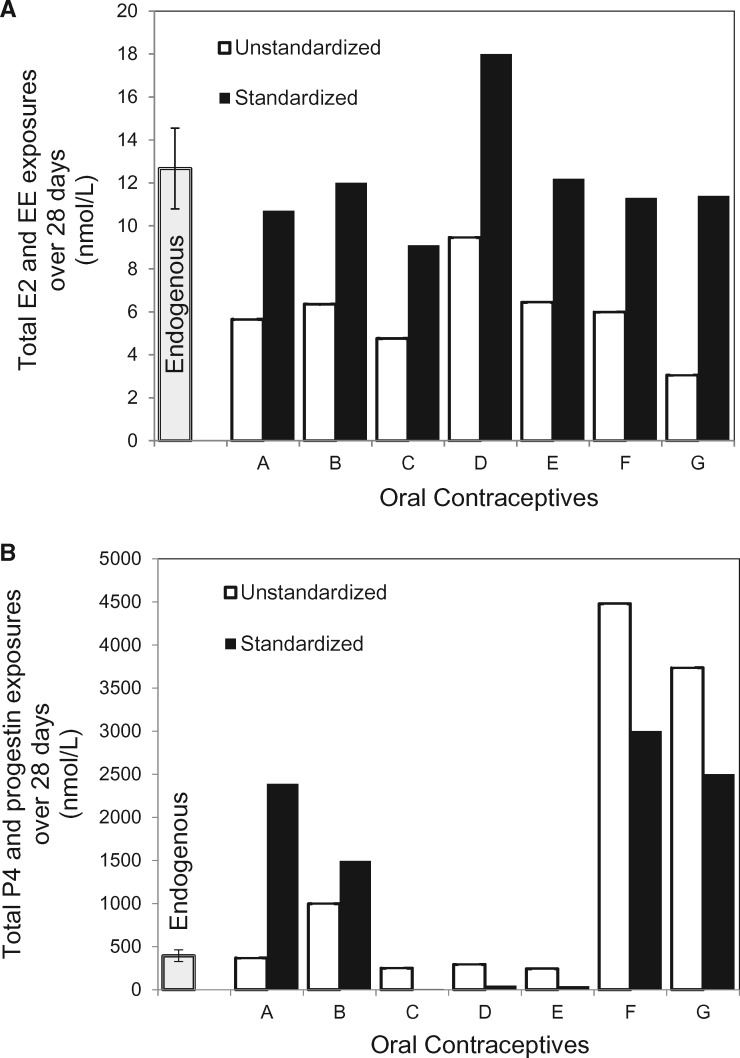
Figure 4.
(A) Over a 28-day cycle, total mean ± SD in nmol/l of endogenous 17-β-estradiol exposure in non-OC-users compared to total exogenous EE exposure from women taking each each of seven OC formulations detailed in Table 1. Open bars are unstandardized EE exposure, and solid bars are EE exposure standardized by the RBA of EE to the estrogen receptor. (B) Over a 28-day cycle, total mean ± SD in nmol/l of endogenous progesterone exposure in non-OC-users compared to exogenous progestin exposure in women taking each OC (A-G). Open bars are unstandardized progestin exposure, and solid bars are progestin exposure standardized by RBA of each progestin to the progesterone receptor (Table 2)

