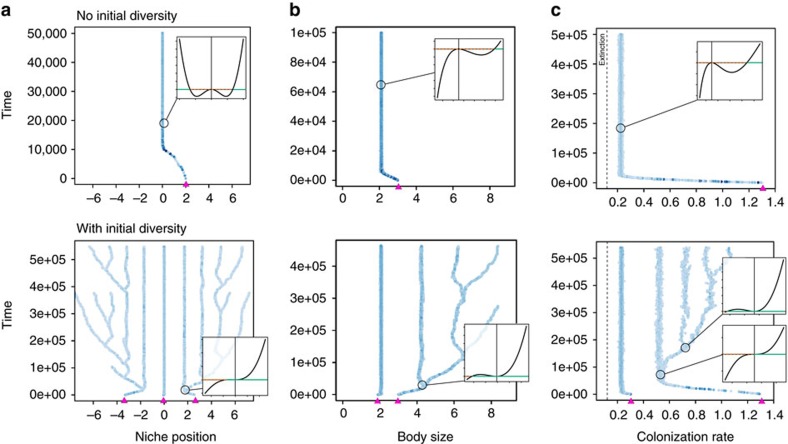
Figure 2. Instances of diversity-dependent adaptive radiation (DDAR) in evolutionary simulations.
Stochastic simulations are shown for the three ecological scenarios (a–c; Fig. 1). Trait values are plotted through evolutionary time, darker shades of blue indicate greater relative abundance. In the three panels, adaptive radiation did not occur if starting with only one species (top), but did occur, for the same parameters, if starting with more than one species (bottom). The initial species and their trait values are shown as purple triangles on the x-axes. Fitness landscapes are shown as inserts. The trait value of the focal species (circle) is located by the vertical line, and the invasion fitness of mutants around this value is plotted (Methods section). The horizontal line corresponds to zero fitness; trait values with positive fitness (solid line) can invade, others cannot (dashed line).

