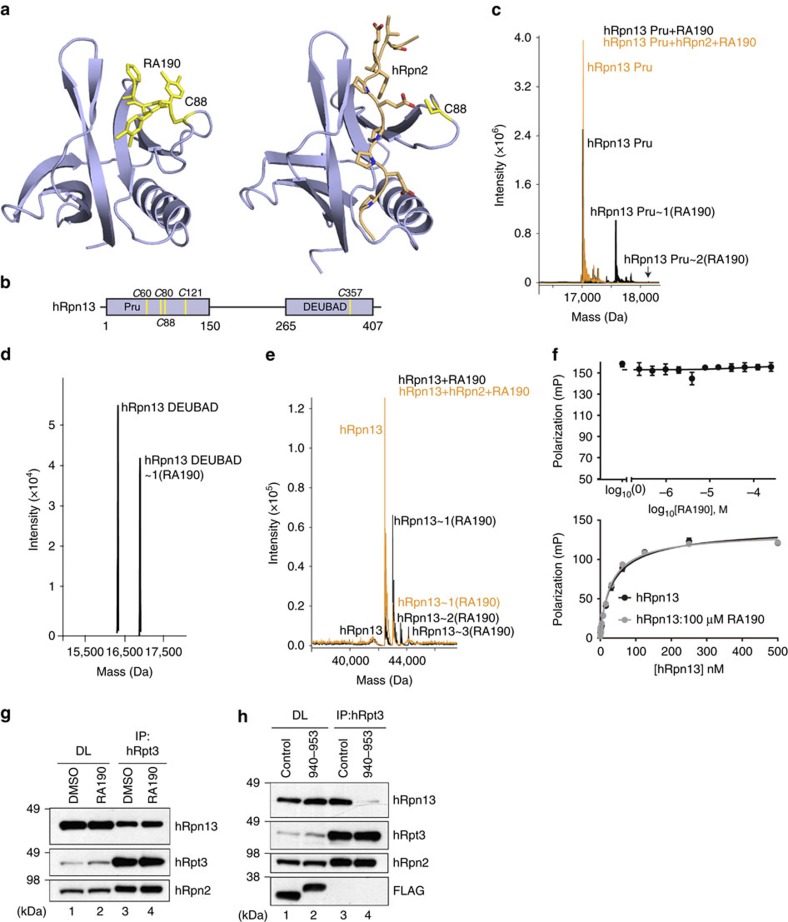
Figure 3. hRpn2 restricts RA190 from binding hRpn13 Pru.
(a) Model of RA190 (yellow) adducted to hRpn13 (periwinkle blue) C88 (yellow, left panel) and NMR structure of hRpn13 Pru-hRpn2 (940–953) (right panel). hRpn2 is orange with nitrogen and oxygen in blue and red, respectively. (b) Schematic representation of hRpn13 domains with locations of cysteines indicated. (c–e) LC-MS analysis of 2 μM hRpn13 (c) Pru (black), (d) DEUBAD or (e) full-length protein (black) or with equimolar hRpn2 (940–953) (orange) following 2 h of incubation with 20 μM RA190. (f) FP values for 30 nM hRpn13 Pru incubated serially for 30 min with indicated RA190 concentrations and 10 nM FITC-hRpn2 (940–953) (upper panel). FP values for 100 μM RA190 or 2% DMSO incubated serially for 30 min with varying concentrations of full-length hRpn13 as indicated (lower panel), followed by 10 nM FITC-hRpn2 (940-953). In both cases, FP values were measured in triplicate and corresponding values for FITC-hRpn2 (940–953) alone were subtracted from the measurements. The final values for each panel were plotted against RA190 concentration and fit using the log(inhibitor) versus response–variable, four parameter model (upper panel) or hRpn13 concentration by a Hill slope model (lower panel). The s.d. of each data point to the average value is displayed by error bar. (g) HCT116 cells were treated with 1 μM RA190 for 24 h or DMSO (as a control) and the cell lysates immunoprobed (DL) or subjected to immunoprecipitation with anti-hRpt3 antibodies before immunoblotting as indicated. (h) Cell lysates (DL) or immunoprecipitates derived by anti-hRpt3 antibodies from HCT116 cells expressing FLAG-EGFP (control) or FLAG-EGFP-hRpn2 (940–953) were subjected to immunoprobing, as indicated.

