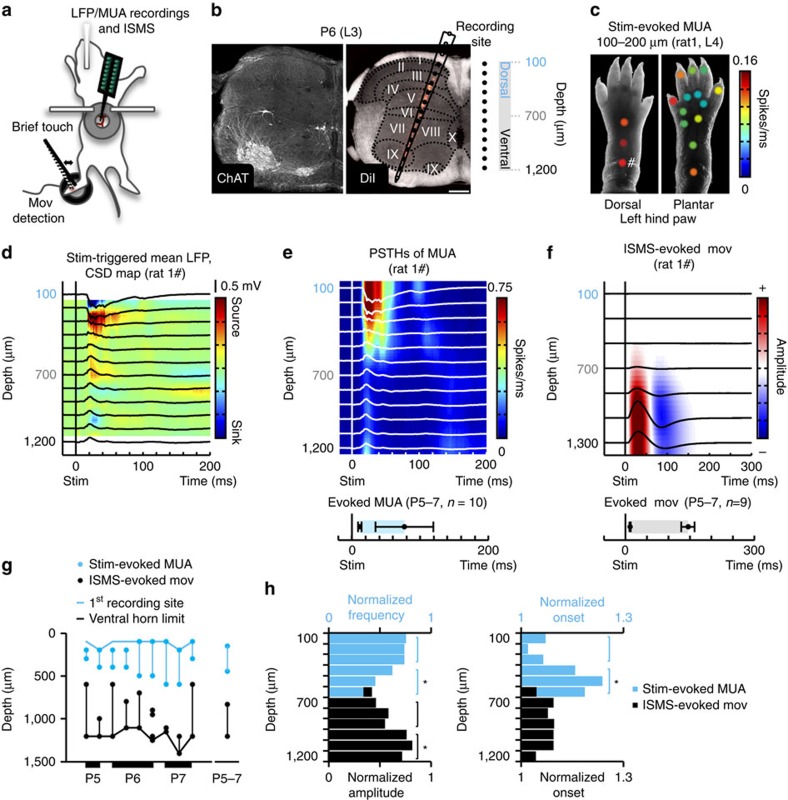
Figure 1. In vivo functional mapping of sensory-motor spinal cord zones.
(a) Schematic illustration of the experimental setup. We recorded spinal cord, translaminar network events, either evoked by mechanical stimulation or spontaneous (and in association with motor behaviour), following which we performed ISMS. (b) Silicone-based electrode array track visualized on a transverse spinal cord section (P6 rat). Left: ChAT+ cells—motoneurons (Alexa633, confocal image). Expression profiles of ChAT+ and NeuN+ cells were used to estimate borders of different spinal cord laminae (Supplementary Fig. 1). Right: Overlaid dark-field image and epi-fluorescence image (DiI, red) of the same slice and to-scale scheme of the electrode array (100 μm between recording sites), denoting the approximate anatomical location each recording site (dashed lines—Rexed laminae borders). Scale bar: 200 μm. (c) Mechanical stimulus (stim)-evoked MUA frequency represented as colour-coded dot overlaid on the corresponding stimulation point in a aged-matched hindlimb photograph (response map, single, anesthetized animal). Note that all firing frequencies correspond to the two recording sites showing the shortest response onsets, which were consistent across all stimulation points (depths of 100 and 200 μm). The response characterized by the highest MUA frequency (marked by #) was considered topographic and is described in more detail in d–e. (d) Stim-triggered mean LFP traces and CSD map (n=100 stimuli, single, non-anesthetized animal). (e) Corresponding normalized translaminar peri-stim time-histograms (PSTHs) of MUA. Note the duration of response across non-anesthetized animals (mean±s.d., n=10). A comparative description of sensory-evoked responses obtained in anesthetized animals is included in Supplementary Fig. 2. (f) Mean movement (mov) traces obtained for each depth of ISMS (n≈50 pulses per depth, under 1.5% isoflurane) overlaid on a respective normalized (colour-coded) amplitude map (single animal). Mov onsets and offsets were as graphed (mean±s.d., n=9 animals). (g) Occurrence, per depth, of mechanical stimulus-evoked MUA responses (light blue) and ISMS-evoked movements (black) per animal (n=9). (h) Left: Mean stim-evoked MUA frequency (light blue, n=15 animals) and ISMS evoked-mov amplitude (black, n=9 animals) per depth. Right: Corresponding mean stim-evoked response onsets and ISMS-evoked mov onsets per depth. *P<0.05 (Wilcoxon rank-sum test).

