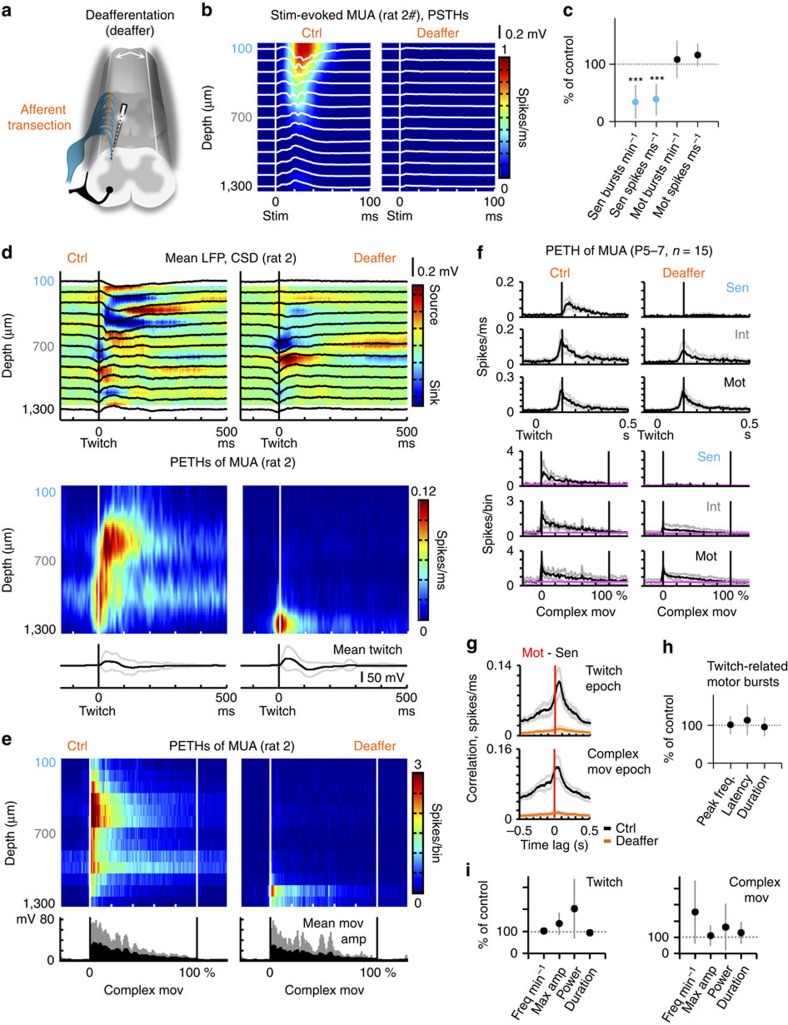
Figure 3. In vivo deafferentation suppresses spontaneous dorsal horn bursting.
(a) Schematic representation of the local deafferentation procedure performed in a subset of animals (n=3 of 15). (b) Mechanical stimulus (stim)-triggered mean LFP traces and corresponding normalized PSTHs of MUA before (Ctrl) and after deafferentation (Deaffer), (n≈100 stimuli per condition, single animal). Note the lack of stim-evoked responses in the after condition. (c) Global effect of deafferentation on bursting and mean firing frequencies in sensory (sen, light blue) and motor (mot, black) zones, graphed as percentage of control (mean±s.d., n=3 animals). (d) Effect of deafferentation on spinal cord network dynamics during twitching (single animal). Top: twitch onset-triggered mean LFP traces and CSD maps before and after deafferentation (nBeforeDeaffer=66 and nAfterDeaffer=108 twitches). Bottom: Corresponding normalized PETHs of MUA, and mean twitch waveforms (black and grey traces: mean±s.d.). (e) Effect of deafferentation on network dynamics during complex movement epochs (single animal). Normalized time-histograms of MUA aligned to complex movement onset (nBeforeDeaffer=66 and nAfterDeaffer=108 complex movements). (f) Top: normalized twitch onset-triggered time-histograms of sen, int and mot MUA before and after deafferentation (black and grey traces: mean±s.d., nBeforeDeaffer=273 twitches and nAfterDeaffer=321 twitches). Bottom: normalized complex movement onset-triggered histograms of sen, int and mot MUA before and after deafferentation (black and grey traces: mean±s.d., nBeforeDeaffer=273 twitches and nAfterDeaffer=321 twitches). (g) Cross-correlograms of peri-twitching and peri-movement mot and sen spikes before and after deafferentation (black and grey traces: mean±s.e.m.). (h) Effect of deafferentation on peri-twitching ventral spiking activity (% of control, mean±s.d.). Graphs showing, for mot, the twitches-related within-bursts MUA peak frequency (spikes ms−1) and respective time in relation to twitch onset (latency), as well as bursts offset (peak frequency to baseline return—duration). (i) Spontaneous behaviour. Twitches and complex movements frequency (min−1), maximal amplitude, power (normalized to duration) and duration after versus before transection of afferent fibers (% of control). ***P<0.001 (a full description of the statistical test used is included in the ‘Materials and methods’ section).

