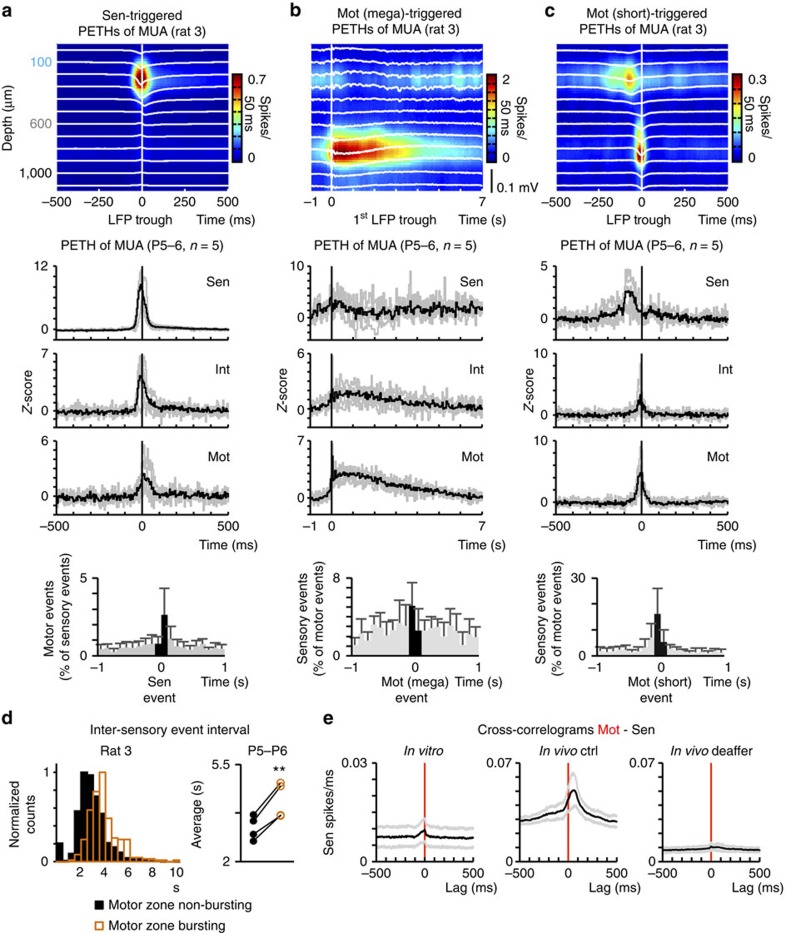
Figure 5. Dissociation of ongoing dorsal and ventral activities in vitro.
(a) Top: Sensory (sen)-bursts triggered normalized histograms of MUA across all spinal depths (single animal). Middle: corresponding normalized PETHs of MUA of sensory (Sen), intermediate (Int) and motor (Mot) zones (Z-scores, grey traces: single animals; black trace: mean, n=5 animals). Bottom: percentage of detected surrounding motor events (mean±s.d., n=5 animals). (b,c) Equivalent graphics instead triggered by long- and short-lasting motor events, respectively. (d) Left: Representative histograms of inter-sensory event intervals during non-bursting and bursting motor zone periods (black and orange, respectively, single animal). Right: Mean inter-event interval values during non-bursting and bursting motor zone periods per animal (n=4). (e) Cross-correlograms of all mot and sen units recorded per animal in vitro (mean±s.e.m., n=5 animals), in vivo under control conditions (mean±s.e.m., n=15 animals) and in vivo after deafferentation (mean±s.e.m., n=3 animals). **P<0.01 (paired two-tailed Student’s t-test).

