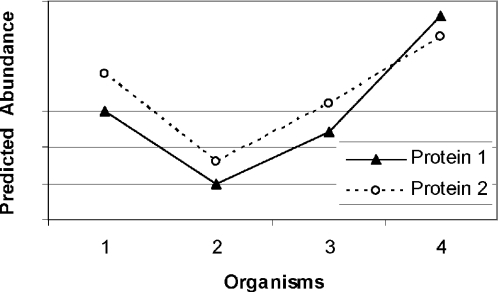
Figure 1.
Illustration of protein abundance profiles. The predicted abundance levels of two proteins, each with orthologs in four organisms, are shown. The first is represented by filled triangles, and the second by open circles. The correlation coefficient between these two abundance profiles can be computed. The connecting lines in the plot are for illustration only.

