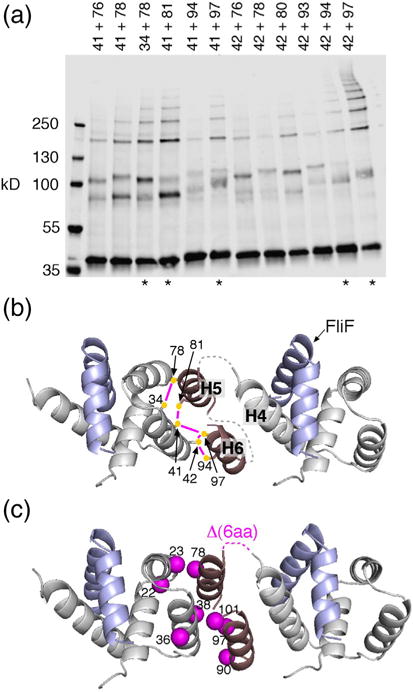
Fig. 7.

Organization of the FliG N-terminal domain. (a) I2-induced crosslinking through pairs of Cys residues in FliGN. Mutant FliG proteins were expressed from the chromosome. Asterisks at the bottom indicate the five highest-yield pairs. (b) Model for the arrangement of FliGN domains based on the crosslinking. The five highest-yield Cys pairs are shown, connected by magenta lines. Dashed lines indicate segments with predicted non-regular secondary structure, 4–5 residues in length, whose conformation is uncertain. Numbers are for the protein of E. coli. (c) Mapping the suppressors of the original FliF–FliG fusion (Fig. 2d and Table 1) onto the model. Mutations cluster at the FliGN–FliGN interface. One of the suppressors is a 6-aa deletion that corresponds with the loop connecting H4 and H5.
