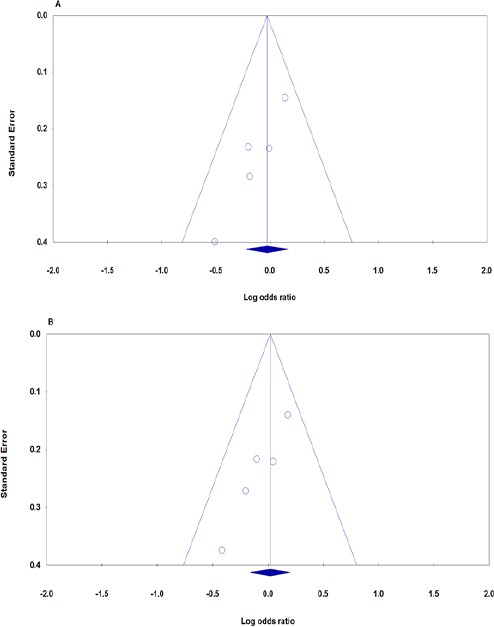
Figure 2.

Begg’s Funnel Plots of FTO rs9939609 Polymorphism Association with Breast Cancer Risk for Publication Bias Test. A: Heterozygote contrast (AT vs. TT), B: Dominant contrast (AA+AT vs. TT). Each point represents a separate study for the indicated association.
