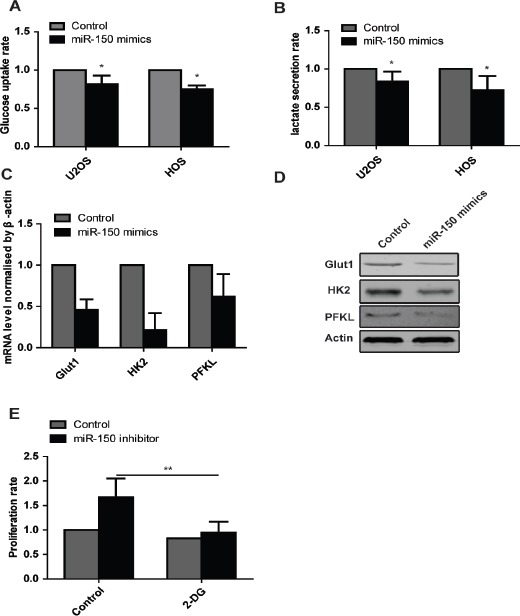
Figure 3.

miR-150 Induces a Metabolic Shift in Osteosarcoma Cells. (A) Glucose uptake assays show that miR-150 decreases glucose uptake rate. (B) Lactate production assays show that miR-150 blocks lactate secretion. (C) Real time PCR show the mRNA level of Glut1, HK2, PFKL in cells transfected with miR-150 mimics. (D) Western blot show the protein level of Glut1, HK2, PFKL in cells transfected with miR-150 mimics. (E) The CCK8 assays show that inhibition of glycolysis with 2-DG blocks the enhanced proliferation rate induced by knockdown of miR-150.
