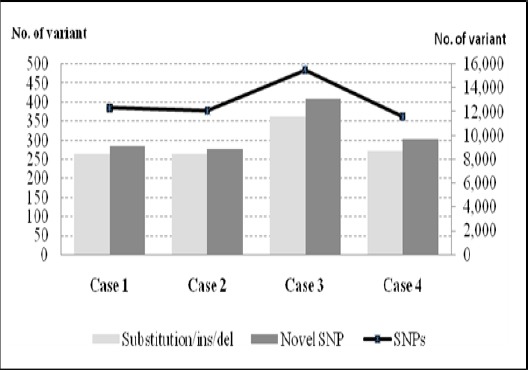
Figure 2.

The Distribution of Somatic Mutations in Coding Region of Cases. The bar chart (left scale) represent individual samples carrying substitution/ins/del and novel SNPs. The line chart (right scale) represent single nucleotide polymorphism (SNPs) in individual ETV6/RUNX1 samples.
