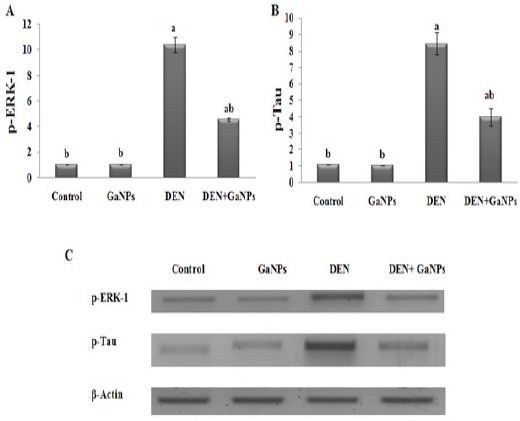
Figure 6.

Effect of GaNPs on Protein Expression of A) p-ERK-1 and B) p-Tau by western blot analysis. C) PAGE of p-ERK-1 (44 kDa), p-Tau (64 kDa) proteins and β-actin (42 kDa) as housekeeping protein. Each value represents the mean ± SE (n=6). a: significantly different from control at p<0.05. b: significantly different from DEN at p<0.05.
