Figure 2.

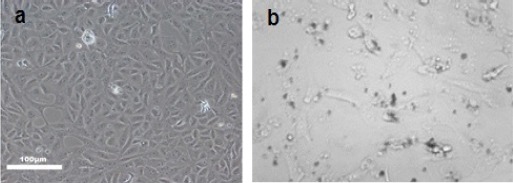
a) Control HepG2cell Line b) HepG2 Cells inCubated with 400µg/ml Graphene Oxide for 24 h, Light Microscopy (Phase Contrast, 40x)

a) Control HepG2cell Line b) HepG2 Cells inCubated with 400µg/ml Graphene Oxide for 24 h, Light Microscopy (Phase Contrast, 40x)