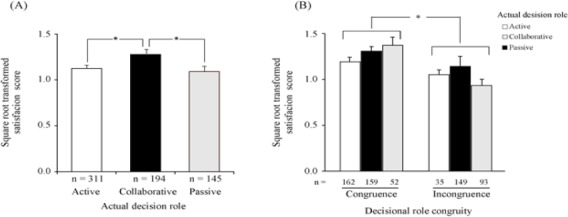
Figure 1.

Association between Satisfaction with Treatment Decision-Making Process and Decisional Role Congruity. Data are Presented as Mean of Square Root Transformed Satisfaction Score in the Decision-Making Process ± Standard Error of the Mean. (A) Level of satisfaction was compared in actual decision roles. p = 0.012 (ANOVA). (B) Participants were categorized based on actual decisional role. p-value: main effect of decisional role congruity, <0.001; main effect of actual role, 0.338; interaction of (decisional role congruity) × (actual role), 0.075; congruence vs. incongruence in passive, <0.001. *:p< 0.001.
