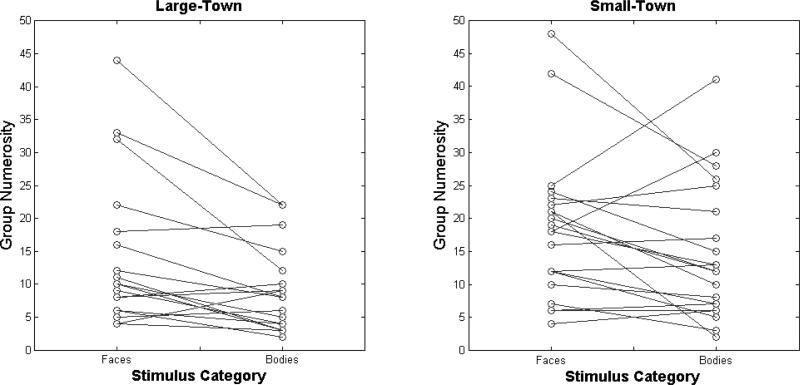
Figure 3.
A plot of the number of groups each participant made in the Face and Body card-sorting task as a function of hometown size. Data points belonging to the same participant are connected by solid lines. Along with Table 1, this figure highlights the variability observed across participants in this task.

