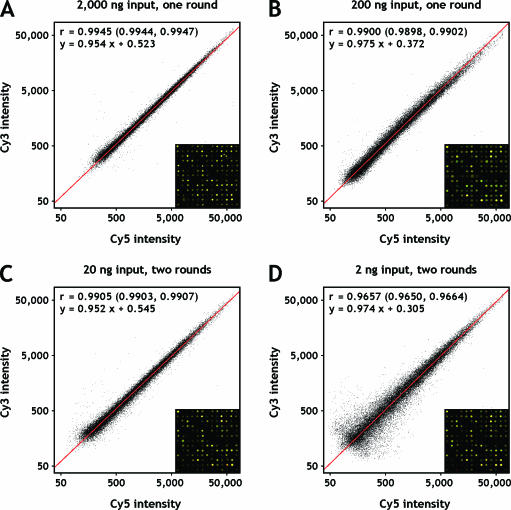
Figure 2.
Scatter plots of fluorescence intensities from replicate amplification and labelling reactions. Co-hybridizations of independently amplified reference RNA were used to assess the reproducibility of amplification under diverse conditions. (A) 2000 ng; (B) 200 ng; (C) 20 ng; (D) 2 ng starting material. Orthogonal regression lines are shown in red; the corresponding linear equations are given together with Pearson correlation coefficients and their 95% confidence intervals. A defined section of the respective microarray image is displayed in the lower right corner of each plot.

