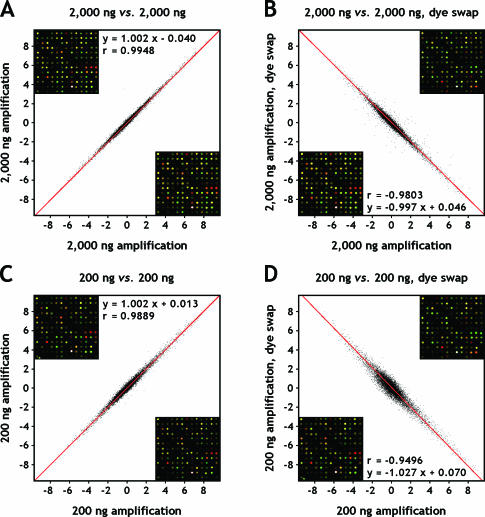
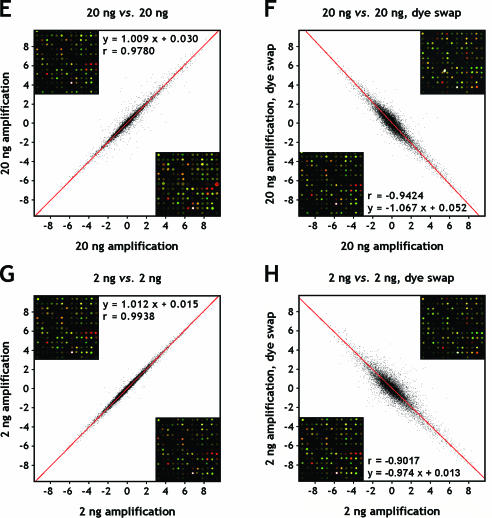
Figure 3.
Scatter plots of log2-transformed expression ratios (log2 Cy5/Cy3) from duplicate hybridizations. Amplified breast and reference RNA, with and without reversed assignment of fluorophores (dye swap) was employed to evaluate the accuracy and reproducibility of the experiment. Replicate spots were averaged. (A) 2000 ng; (B) 2000 ng, dye swap; (C) 200 ng; (D) 200 ng, dye swap; (E) 20 ng; (F) 20 ng, dye swap; (G) 2 ng; (H) 2 ng, dye swap. The data were subjected to orthogonal regression analysis (red lines), and associated linear equations are listed along with Pearson correlation coefficients. The 95% confidence intervals of the correlation coefficients are (0.9946, 0.9950), (−0.9809, −0.9796), (0.9885, 0.9892), (−0.9513, −0.9478), (0.9772, 0.9788), (−0.9444, −0.9404), (0.9936, 0.9940) and (−0.9050, −0.8983) for (A) through (H). Underlying microarray images are shown as fixed sections in an upper (ordinate) and lower (abscissa) corner of each plot.


