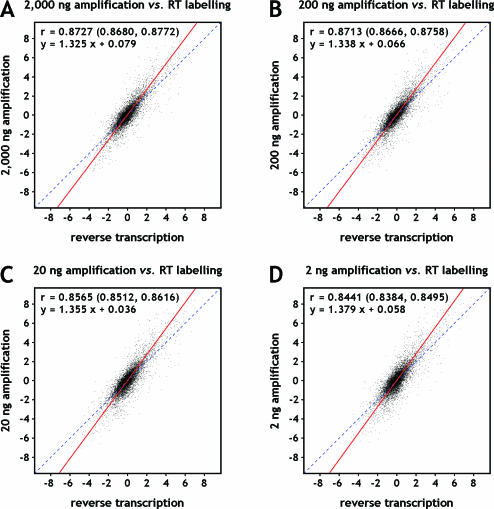
Figure 4.
Scatter plots comparing log2-transformed expression ratios of amplified targets to ratios obtained with unamplified targets. Breast and reference RNA was used as starting material. Dye swap experiments were combined before plotting. Target amplified (TAcKLE) from (A) 2000 ng, (B) 200 ng, (C) 20 ng and (D) 2 ng starting material was compared with unamplified target prepared by reverse transcription labelling. Orthogonal regression analysis was preformed to derive the regression lines shown in red and their respective linear equations. Dashed lines through origin with slope 1 are displayed to accentuate the elevated slope. Pearson correlation coefficients and their associated 95% confidence intervals are listed as well.

