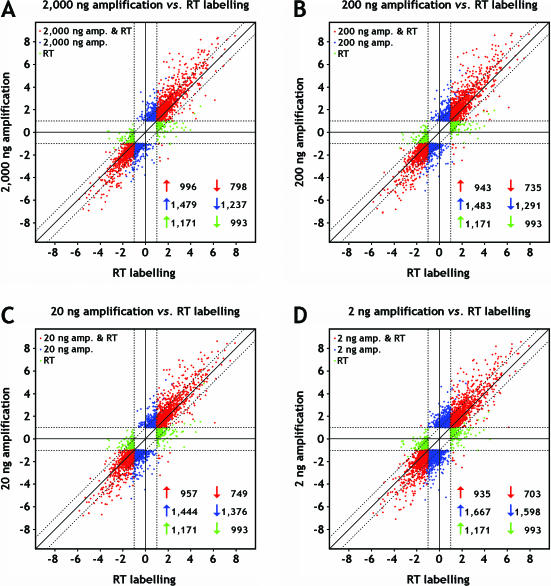
Figure 5.
Scatter plots showing log2 ratios of the genes detected as differentially expressed between breast and reference RNA by either one or both target preparation techniques (reverse transcription labelling and amplification via the TAcKLE protocol). Data are shown for the comparisons of RT labelling versus targets prepared from (A) 2000 ng, (B) 200 ng, (C) 20 ng and (D) 2 ng starting material. Genes showing differential expression with both methods are shown as red dots, while blue and green dots denote genes only found by amplification or RT labelling, respectively. The numbers of genes found up- or down-regulated with either one or both methods are given in the lower right corners of the plots.

