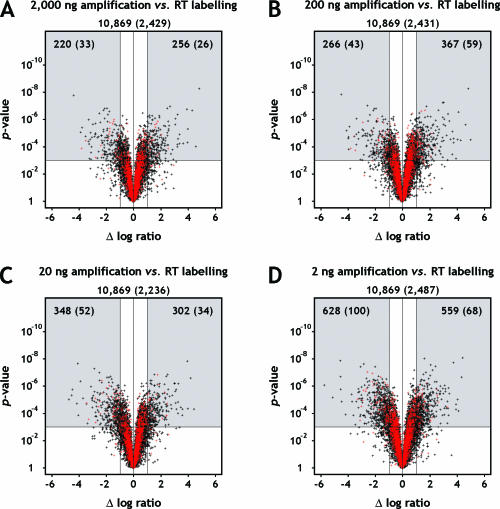
Figure 7.
Volcano plots of P-values against the difference of log2-transformed expression ratios. The difference of log2 ratios observed between amplified and unamplified targets (log2 [breast/reference]TAcKLE − log2 [breast/reference]RT) is shown on the x-axis. The corresponding P-value of significance, derived by linear modelling, is shown on the y-axis. Ratios of targets amplified from (A) 2000 ng, (B) 200 ng, (C) 20 ng and (D) 2 ng starting material were compared with ratios of unamplified targets. Black dots correspond to probes detected on all or all but one arrays of all target preparation approaches, red dots indicate probes which additionally reached fluorescence intensities at least two standard deviations above local background on the arrays under consideration. The associated numbers of genes are given underneath the panel headings, values for red dots printed in parentheses. The plots were segmented to illustrate the relation of statistical significance (P < 0.001) to significance based on a 2-fold change criterion. Only genes indicated by spots in the upper left and right segments of the plots satisfy both criteria, their numbers explicitly shown. Genes located in the lower left and right segments display a large fold-change difference between amplified and unamplified targets but fail to achieve statistical significance. Genes found in the middle segments show no relevant difference of expression ratios, with (upper segments) or without (lower segments) additional statistical significance associated with this observation.

