Figure 3.

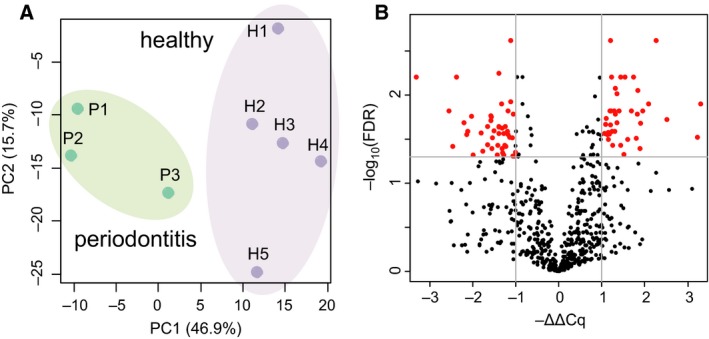
Expression profiling of miRNAs in GCF sample set #1. (A) PCA of miRNA expression profiles. Two‐dimensional scatter plot represents the differential miRNA expression patterns of healthy (H1–H5; n = 5) and periodontitis (P1–P3; n = 3) GCF samples (sample set #1). The x‐axis indicates PCA Component 1 (PC1: 46.9% variance) and the y‐axis shows PCA Component 2 (PC2: 15.7% variance). (B) Volcano plot showing differential expression of miRNAs between healthy and periodontitis subjects. The x‐axis represents relative expression ratios shown as −ΔΔCq values. The y‐axis indicates −log10(FDR q‐value) between the two groups. The lines indicate cutoff of FDR q‐value < 0.05 and |ΔΔCq| > 1.0. Red dots are miRNAs that meet these criteria.
