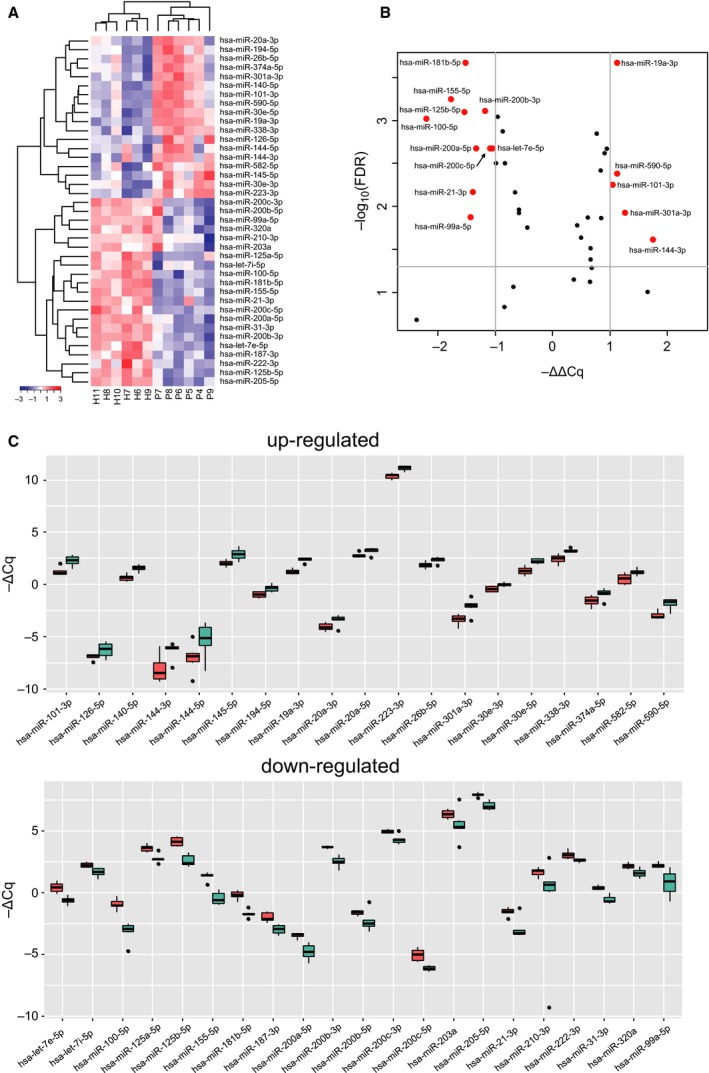
Figure 6.

Expression of selected 40 miRNAs in GCF sample set #2. (A) Two‐dimensional hierarchical clustering of miRNA expression levels in healthy (H6‐H11; n = 6) and periodontitis (P4‐P9; n = 6) GCF samples (sample set #2). Red to blue color gradient of heatmap shows the relative expression levels based on −ΔCq values. The results of 40 selected miRNAs except hsa‐miR‐20a‐5p are displayed since amplification for hsa‐miR‐20a‐5p failed in the P7 sample. (B) Volcano plot showing differential expression of miRNAs between healthy and periodontitis subjects. The x‐axis represents relative expression ratios shown as −ΔΔCq values. The y‐axis indicates −log10(FDR q‐value) between the two groups. The lines indicate cut‐off of FDR q‐value < 0.05 and |ΔΔCq| > 1.0. Red dots are miRNAs that meet these criteria. (C) Box plot showing expression levels of miRNAs indicated as −ΔCq. Red and green boxes represent the values of healthy (n = 6) and periodontitis (n = 6) groups, respectively. The central line in the box indicates the median value. The result of hsa‐miR‐20a‐5p expression in the periodontitis group was obtained from five samples. The upper panel shows the values of 19 up‐regulated miRNAs while the lower panel shows the values of 21 down‐regulated miRNAs.
