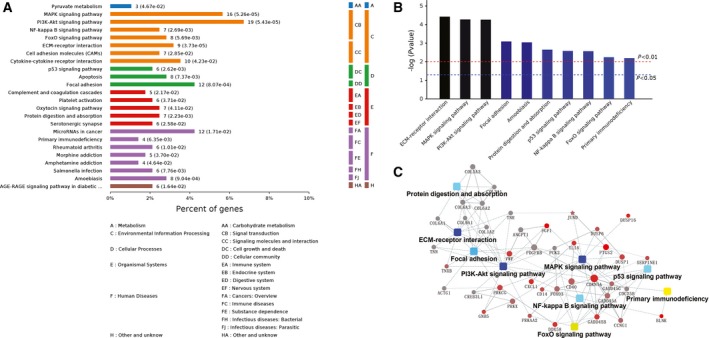
Figure 6.

KEGG pathway analyses of RNA‐seq results. (A) The main KEGG pathways that the 385 changed genes lye in. (B) Ranking of top 10 pathways by P values. (C) Network analysis of the main signaling pathways that changed in the 30 p.p.m. FR L‐929 cells.
