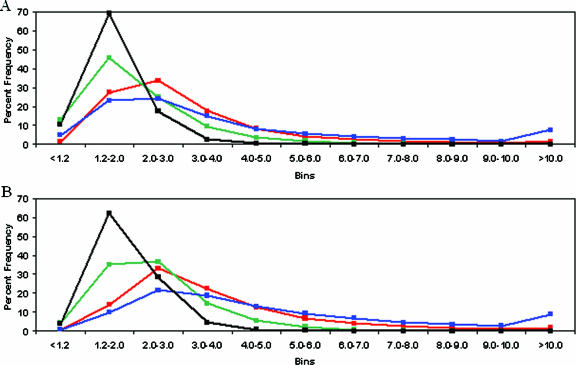
Figure 3.
Distribution of binned hybridization specificity values. The relative percent frequencies of hybridization specificity ratios (y-axis) for substitution (red), one base deletion (green), two base deletion (blue) and one base insertion (black) probes present within distinct bins (x-axis) are provided for sense (A) and antisense (B) microarrays. Hybridization specificity ratios are averaged across 68 experiments on each strand.

