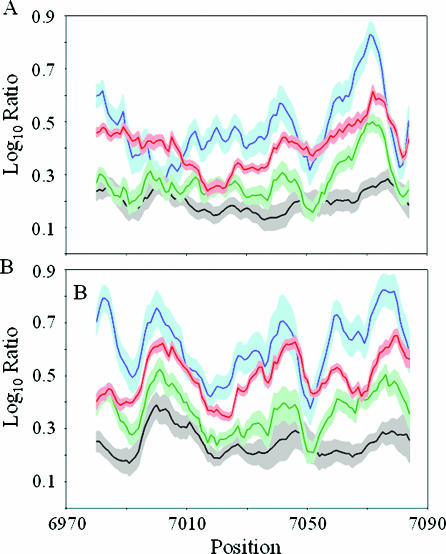
Figure 4.
Hybridization specificities of mismatch probes. A 10-base running window of the log10 hybridization specificity ratios of substitution (red), one base deletion (green), two base deletion (blue) and one base insertion (black) was plotted for the sense (A) and antisense (B) strands of ATM exon 50. The light red, light green, light blue and gray shaded areas represent ±1 SD of the log10 hybridization specificity ratios for the substitution, one base deletion, two base deletion and one base insertion probes, respectively.

