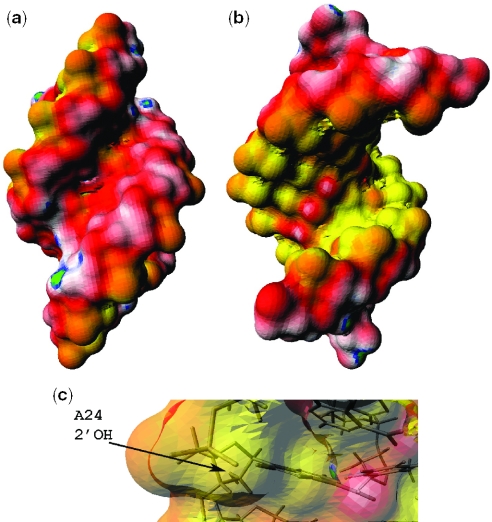
Figure 3.
Surface electrostatic potential maps of uBP. The atomic charge and radii are those from the AMBER94 molecular mechanical force field. The color scheme used in this map is as follows: yellow is the most negative (−3 kcal/mol/e) and green is the most positive (1 kcal/mol/e). White is neutral. Red and blue represent negative and positive potentials, respectively. The calculation was performed using the hybrid nonlinear PBE approach as described in the Methods. (a) The surface electrostatic potential map of the minor groove, (b) the surface electrostatic potential map of the major groove and (c) the surface electrostatic potential map of the branch site region combined with a ball-and-stick model of the molecule.

