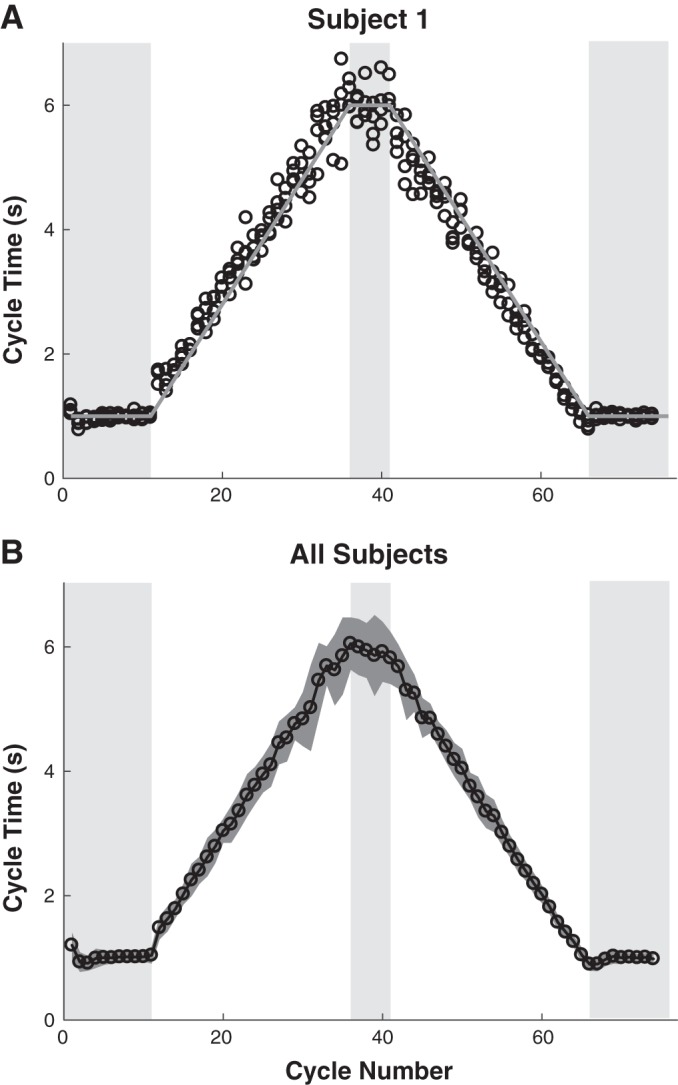
Fig. 5.

Cycle time as a function of cycle number. A: data for all 4 trials of 1 exemplary subject. Gray line indicates period prescribed by the metronome. The shaded areas mark the segments with constant periods. B: mean values of all subjects and trials. Means are calculated across 9 subjects and 4 trials and for both movements within a cycle. The gray shading depicts the standard deviation.
