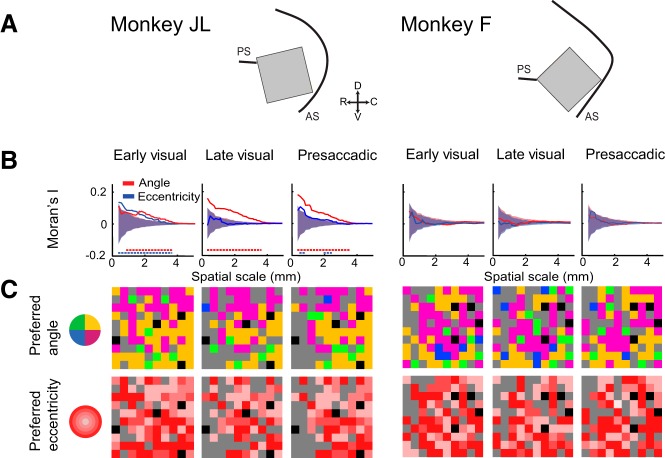
Fig. 10.
Anatomical clustering as a function of angle and eccentricity. A: schematic illustrating position of array implants. B: magnitude of clustering (Moran’s I) as a function of angle and eccentricity. Dashed lines of each color indicate the extent of significant clustering for each spatial dimension. C: preferred angle (top) and eccentricity (bottom) mapped onto array according to their respective color maps. Gray channels are nontuned; black channels are ground electrodes.

