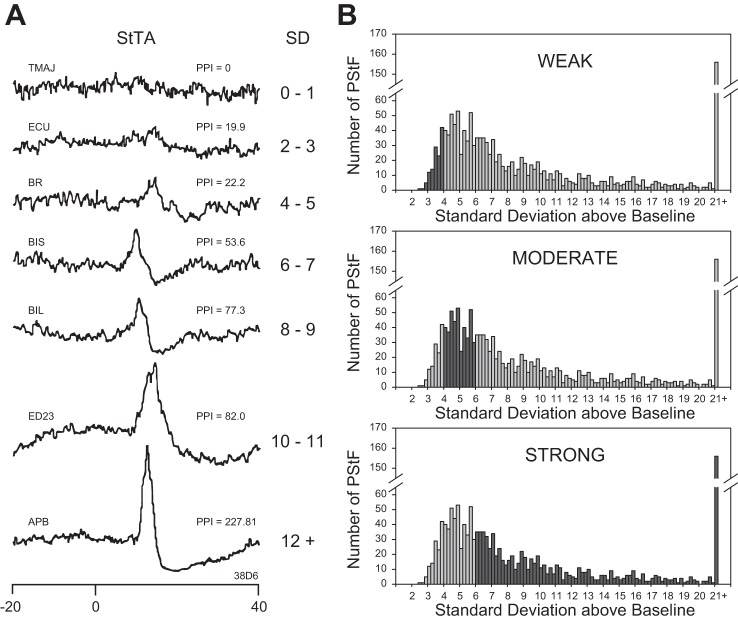
Fig. 1.
A: examples of stimulus-triggered averages (StTA) of rectified EMG activity (15 µA at 15 Hz) illustrating different strength categories of poststimulus facilitation (PStF) effects based on PStF peak magnitude expressed as the number of standard deviations of the peak from the baseline mean (SD or peak-to-noise ratio). Also shown is PStF strength expressed as peak percent increase (PPI) obtained by subtracting the baseline from the peak and dividing by the baseline. Time 0 corresponds to the stimulus event used as a trigger for averaging. A pretrigger period of 12.5 ms (baseline) was used to determine mean baseline activity and SD for each average. Muscle abbreviations are listed in Table 1. B: frequency plots showing the distribution of magnitudes of PStF effects categorized as weak, moderate, and strong (black bars) as a component of the total distribution.

