Fig. 2.
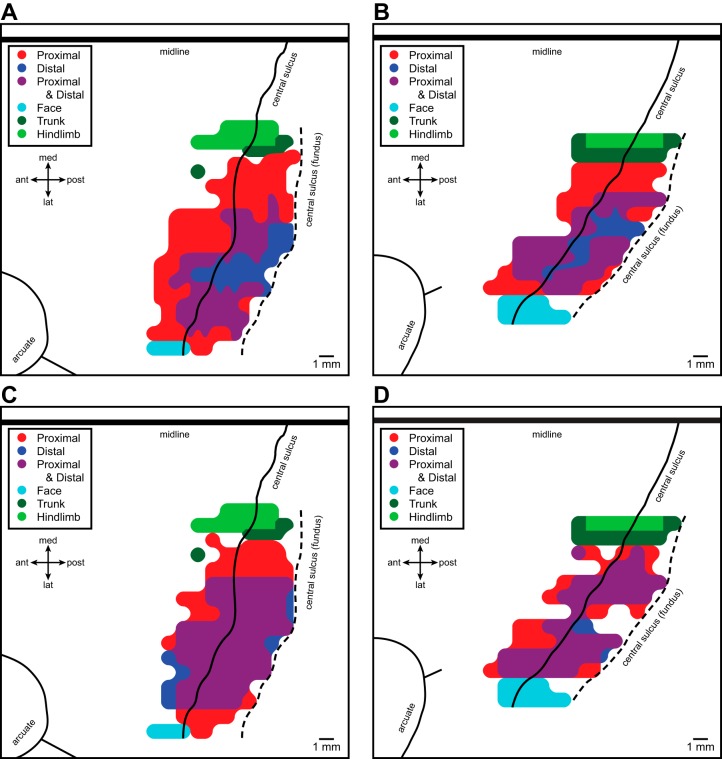
Maps of facilitation (A and B) and suppression (C and D) effects obtained from motor cortex of two monkeys represented in two-dimensional coordinates after unfolding the precentral gyrus. A and B: maps for monkeys D and M, respectively, based on all PStF effects (strong, moderate, and weak) together with high-frequency, short-duration ICMS (HFSD-ICMS)-evoked movements delineating the borders of the forelimb representation with face, trunk, and hindlimb representations (from Park et al. 2001, by permission). C and D: maps for monkeys D and M, respectively, based on all PStS effects, together with HFSD-ICMS-evoked movements delineating the borders of the forelimb representation. Black line is the convexity of the precentral gyrus representing the boundary between rostral and caudal M1 (Rathelot and Strick, 2006, 2009); black dashed line is the fundus of the central sulcus. The midline and arcuate sulcus with spur are also shown.

