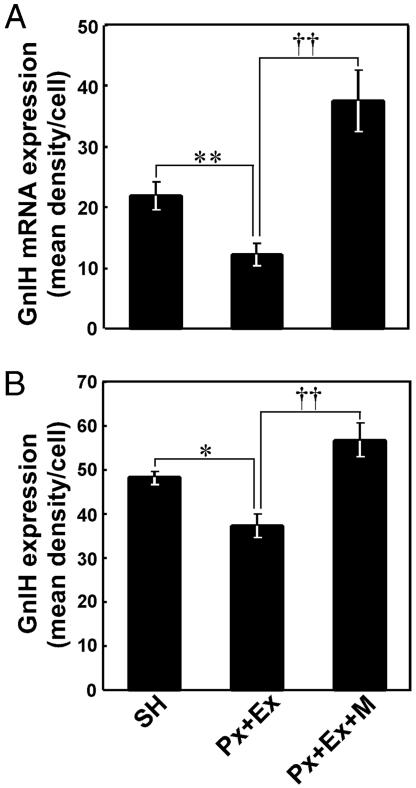
Fig. 3.
Quantitative analyses of the expression of GnIH precursor mRNA (A) and GnIH content (B) in PVN neurons in the SH, Px plus Ex, and Px plus Ex plus melatonin birds. The immunoreactivity of individual neurons was measured as a gray scale value from 0 (white) to 256 (black) and expressed as the mean density per cell, which was obtained by subtracting background gray values. Each column and the vertical line represent the mean ± SEM (n = 5 samples; one sample from one bird). **, P < 0.01; *, P < 0.05, SH versus Px plus Ex; ††, P < 0.01, Px plus Ex versus Px plus Ex plus melatonin by one-way ANOVA, followed by Duncan's multiple range test.

