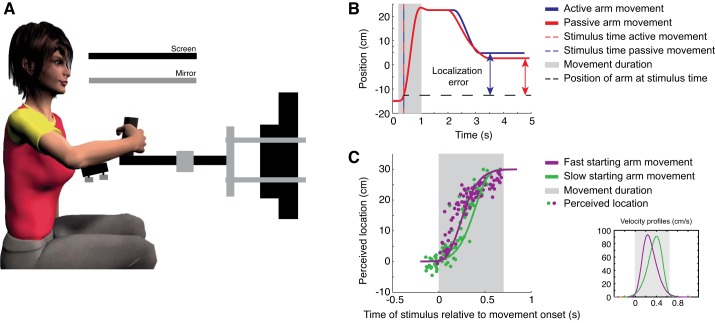
Fig. 1.
A: schematic overview of the setup. Participants performed active and passive arm movements. A custom-built air sled supported the forearm to reduce muscle activity to hold the handle of the robot arm. B: single trial representation in the active (blue) and passive (red) condition. Dashed red and blue line indicates the time of the stimulus and the black dashed line the location of the hand at the time of the stimulus. Double arrows indicate the localization error. Movement duration is shown in gray. C: perceived locations (dots) along the trajectory of a single participant in the 2nd experiment. Solid lines represent the trajectories over time. Movement duration is shown in gray. The different velocity profiles are shown at bottom right corner.

