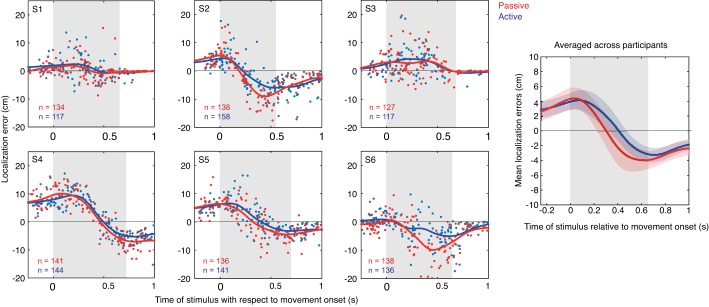
Fig. 3.
Left: localization errors in the passive (red dots) and active (blue dots) trials for each participant. Gray shaded area represents the arm movement duration. Solid line represents a moving Gaussian window (σ = 100 ms). Right: mean localization curves across all participants for both passive and active trials.

