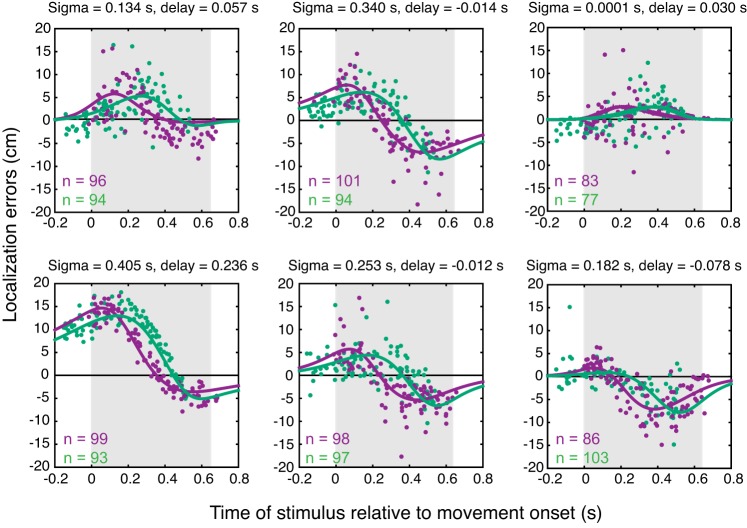
Fig. 4.
Localization errors in the 2 skewed velocity conditions plotted separately for each participant. Purple dots, fast-starting trials; green dots, slow-starting trials. Solid lines represent the model fits, with the values of the 2 fitted parameters (sigma and delay) presented above each graph.

