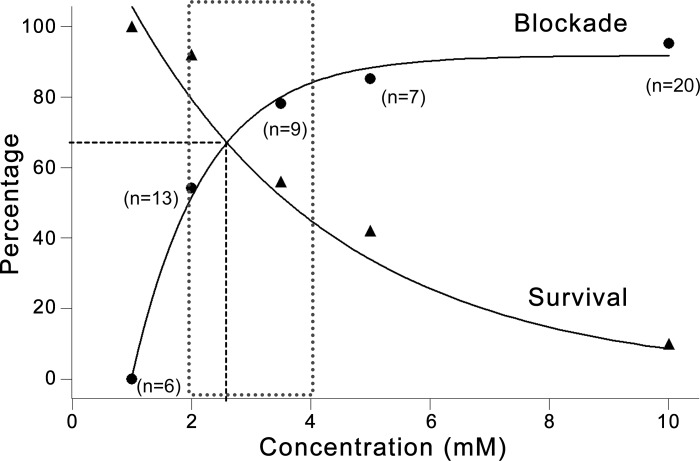
Fig. 6.
Dose responses of 2-DG on network burst blockade and slice survival. Graph summarizes the dose responses of 2-DG on network bursts (circles) and on slice survival (triangles), represented by the percentage of slices showing complete burst blockade or the percentage of slice survival (defined in results) as a function of 2-DG concentration. The blockade curve is fitted with exponential cumulative probability, and the survival curve with exponential decay. In general, burst blockade increases while slice survival decreases with increasing 2-DG concentration. The efficacy of 2-DG burst blockade approaches a steady-state around 3.5 mM, after which slice survival rate drops exponentially. The dotted area represents a feasible dose window for 2-DG (2-4 mM) to effectively block epileptiform bursts while not causing major neuronal damage. The theoretically optimum 2-DG dose may be at the intersection of the two curves, where ~70% slices will stop bursting and remain viable (horizontal dashed line), corresponding to ~2.7 mM 2-DG (vertical dashed line).

