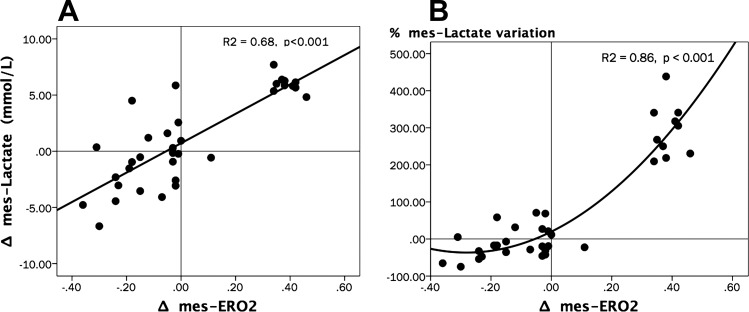
Fig. 7.
Relationships between variations of Δ, Δmes-Lactate, and %mes-Lactate variation. A: scatterplot depicting the relationships between Δ vs. Δmes-Lactate. Spearman Rho test, R2 = 0.68, P < 0.001. B: scatterplot depicting the relationships between Δ vs. %mes-Lactate variation. Spearman Rho test, R2 = 0.86, P < 0.001. All percentage or absolute variations (Δ) were calculated as the variation between actual and its immediately preceding value (A and B).

