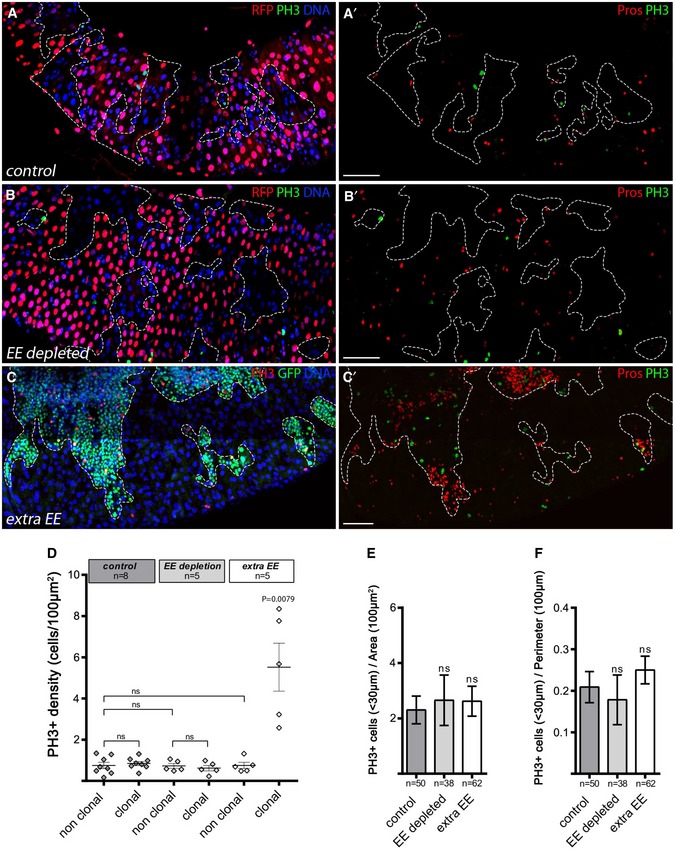
A–CAdult posterior midguts containing control clones, those lacking EEs, or with extra EEs (clones outlined), observed 10 days AHS. Images are compiled tile scans stitched together in Zen software. In (A, C), we used a modified MARCM technique in which ProsGal4 was clonally activated when GAL80 was clonally lost through FLP/FRT‐mediated mitotic recombination. Clones were detected by the loss of RFP baring Gal80 chromosome. (A, A′) Control wild‐type clones marked by lack of RFP expression, DNA in blue, dividing cells marked by PH3 in green and EE cells marked by Pros in red (right panel). (B, B′) EE depletion by clonal expression of rpr under the control of prosGal4 using the GAL80 system in negatively marked clones (lacking RFP expression and GAL80 expression). (C, C′) EE accumulation in MARCM clones (green) expressing an RNAi against Notch. DAPI in blue, EE cells marked through Pros, in red and dividing cells marked by PH3 in green and red as indicated. Scale bar = 100 μm.

