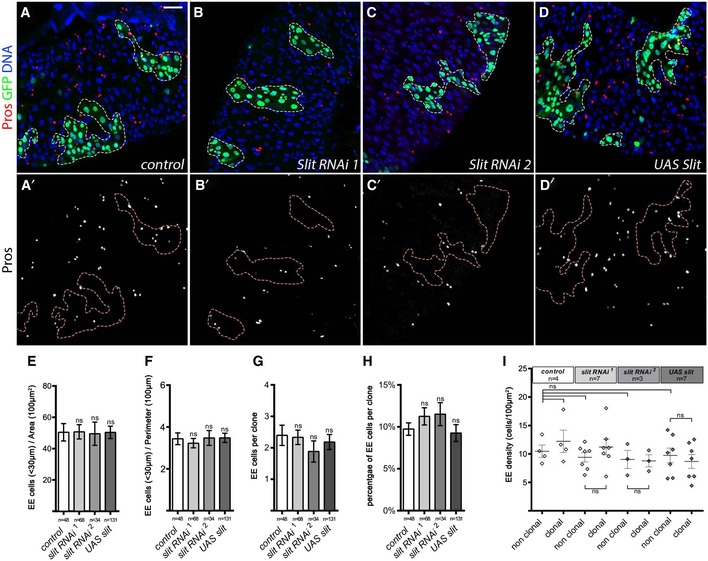
Figure 2. Slit/Robo pathway is not involved on local EE cell fate regulation.

-
A–DPosterior midguts containing 10 days AHS MARCM clones outlined with dotted lines (GFP, green; EE cells, Pros, red; DAPI, blue). Scale bar = 30 μm. No variation of EE density was observed in the clonal periphery or within the clones when comparing (A, A′) control MARCM clones with (B–C′) clones expressing two different RNAis against slit or (D, D′) clones expressing UAS‐slit.
-
E, FNumber of EE cells located in 30 μm around each clone normalized by clonal area (E) and clonal perimeter (F).
-
G–IQuantification of (G) the average number of EE cells per clone, (H) the percent of EE cells per clone, and (I) the global EE density measured in clonal and non‐clonal compartments in the different clonal condition.
