-
A
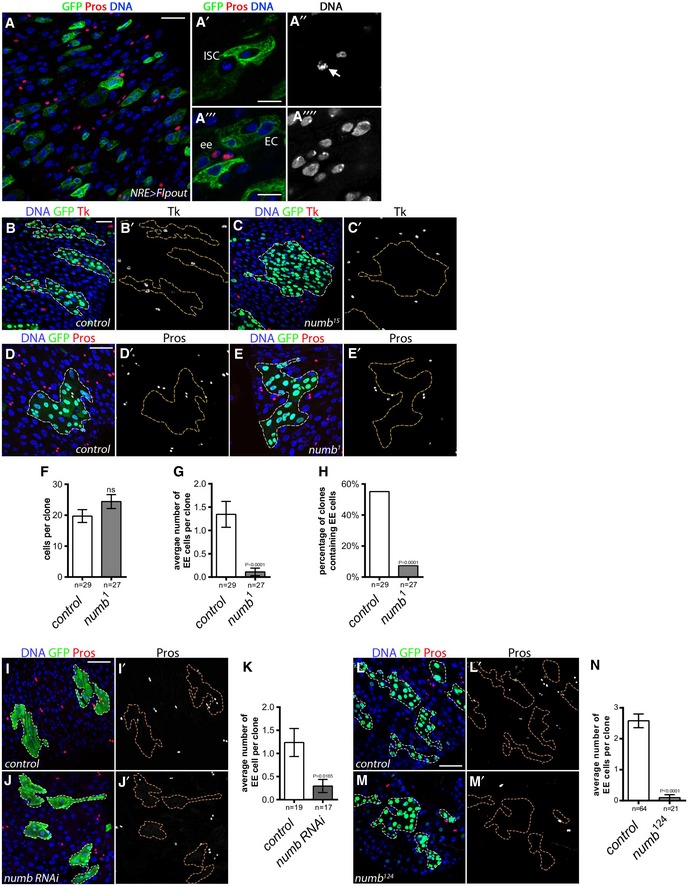
Lineage tracing from Notch signaling‐activated cells using “Flp‐out” strategy: (A) UAS‐flippase under the control of a Notch response element (NRE)‐Gal4 triggered stable GFP expression from the “Flp‐out” cassette in cells where Notch pathway was active. After 5 days at 29°C, we observed that EE cells were never labeled by GFP suggesting that EE cells do not derive from a Notch active cell (GFP, green; EE cells marked by Pros, in red; DAPI, blue). (A′, A′′) Detail of a GFP‐negative dividing ISC. (A′′′, A′′′′) Detail of GFP‐negative EEs and GFP‐positive ECs. Scale bars = 20 μm (A), 10 μm (A′, A′′′).
-
B, C
(B, B′) Tk‐positive cells were present in wild‐type clones at 10 days AHS MARCM (GFP, green; Tachykinin (Tk) staining, red; DAPI, blue, whereas (C, C′) Tk‐positive cells were absent in numb
15 mutant clones. Scale bar = 30 μm.
-
D, E
(D, D′) EE cells were present in control clones at 5 days AHS, whereas (E, E′) EE cells are lost in numb
1 mutant clones (GFP, green; EE cells marked by Pros; DAPI, blue). Scale bar = 30 μm.
-
F–H
Quantification of (F) the average clone size, (G) the average number of EE cells per clone, and (H) the percentage of clones that contained at least one EE cell. Results were compared using two‐tailed Mann–Whitney test for (F, G); and the Fisher's exact test for (H) (ns = non‐significant (P‐value indicated). The bars represent mean values ± SEM.
-
I, J
Control (I) and numb RNAi (J) expressing clone made via heat‐shock‐induced excision of a stop cassette allowing Act‐Gal4‐driven RNAi expression (outlined GFP, green; EE cells marked by Pros; DAPI, blue). Scale bar = 30 μm.
-
K
Average number of EE cells per clone in wild‐type clones and clones expressing a numb RNAi. Results were compared using two‐tailed Mann–Whitney test (P‐value indicated). The bars represent mean values ± SEM.
-
L, M
(L, L′) EE cells were present in control clones at 10 days AHS, whereas (M, M′) EE cells are lacking in numb
124 mutant clones (GFP, green; EE cells marked by Pros; DAPI, blue). Scale bar = 30 μm.
-
N
Average number of EE cells per clone in wild‐type clones and numb
124. Results were compared using a two‐tailed Mann–Whitney test. The bars represent mean values ± SEM.

