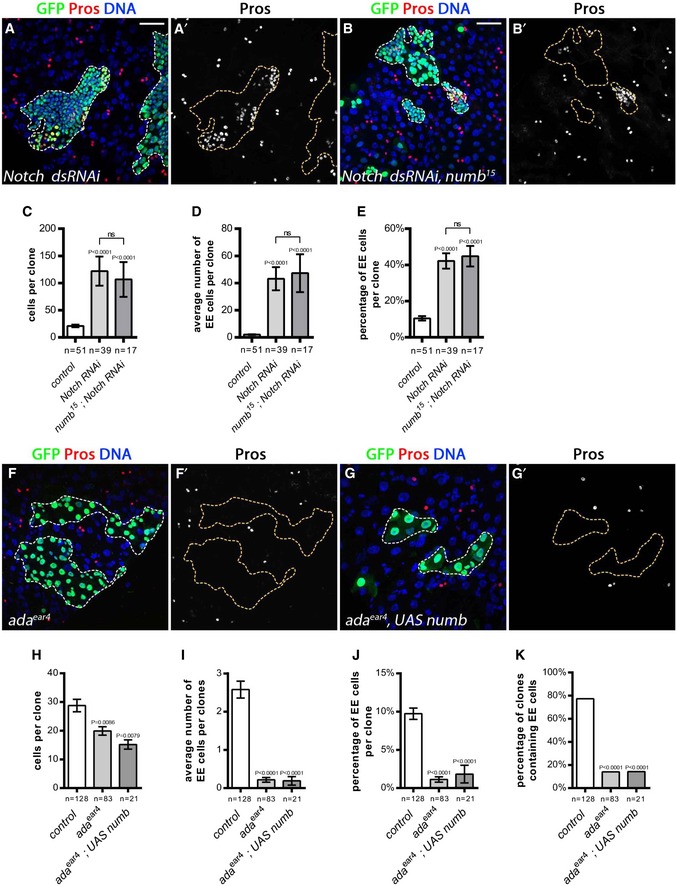
A–K(A–B′; F–G′) 10 days AHS MARCM clones outlined with dotted lines (GFP, green; EE cells marked by Pros, in red or white as indicated; DAPI, blue). (A, A′) Notch RNAi resulted in extra EE cells. (B, B′) Similarly, a numb
15 mutant clone expressing Notch RNAi contained extra EE cells. Quantification of: (C) clone size, (D) the average number of EE cells per clone, and (E) the percentage of EE cells per clone. (F, F′) EE cells were greatly reduced in ada
ear4 mutant clones. (G, G′) Expression of UAS‐numb did not promote EE cell production in ada
ear4 mutant clones. Quantification of: (H) clone size, (I) the average number of EE cells per clone, (J) the percentage of EE cells per clone, and (K) and percentage of clones containing at least one EE cell.

